As part of completing the course Meteorological Observation Systems (ATM322) at the University of Helsinki, we had to execute a radio sounding (weather balloon release) in November 2021 and write a report about the results. This is one of the examples of why I think the meteorology study track at the University of Helsinki is great: not only do you learn about all aspects of meteorology in theory, there is also a practical side to the study.
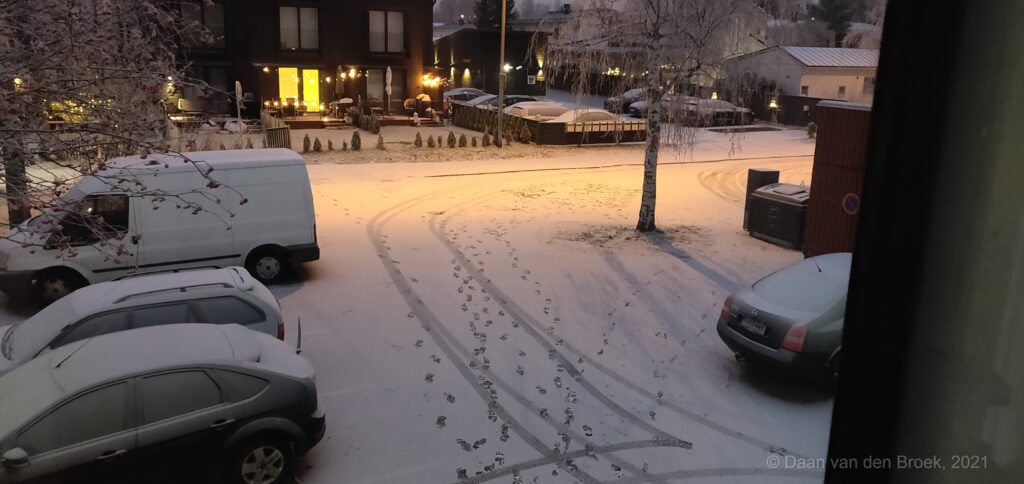
I followed the course Meteorological Observation Systems (ATM322) in the 2nd period (roughly from the start of November to the Christmas Holidays) of 2021, in my second year studying as a master student at the University of Helsinki. The radio soundings were done in groups, and it was our group’s turn on Monday the 15th of November. When I woke up before leaving for the university, I looked out of my window and saw a very nice surprise: it was actually the first time of the winter of 21/22 with a (tiny) snow cover on the ground!

On top of Kumpula Campus
Around 9:40 local time, after preparing the radiosonde, we went onto the roof of the Physicum building at the Kumpula Campus. On top of Physicum you generally have a beautiful view of Helsinki, but this day it was extra pretty due to the rime on the trees.
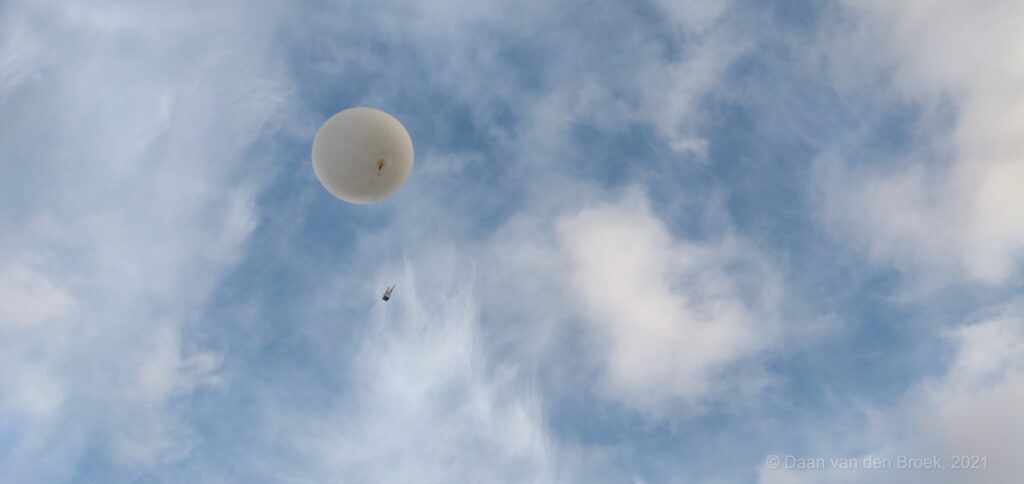
While on the roof, waiting for clearance from the Helsinki-Vantaa airport for our weather balloon release, we analysed the clouds and made pictures of them. Those analyses and pictures would be beneficial for the report we had to write.
Weather situation during our radio sounding
First of all, while letting up the weather balloon, we observed three main cloud types: stratocumulus (relatively low), altocumulus above that and cirrus clouds even higher. At the time we released our weather balloon, the rime on the trees just started thawing and the wind was southeasterly. If we look at the weather map for that day (see the image below), we can see that a high pressure system is located with its core close to Helsinki. At the same time, an upper-air ridge is visible.

Analysis of the radio sounding for Meteorological Observation Systems
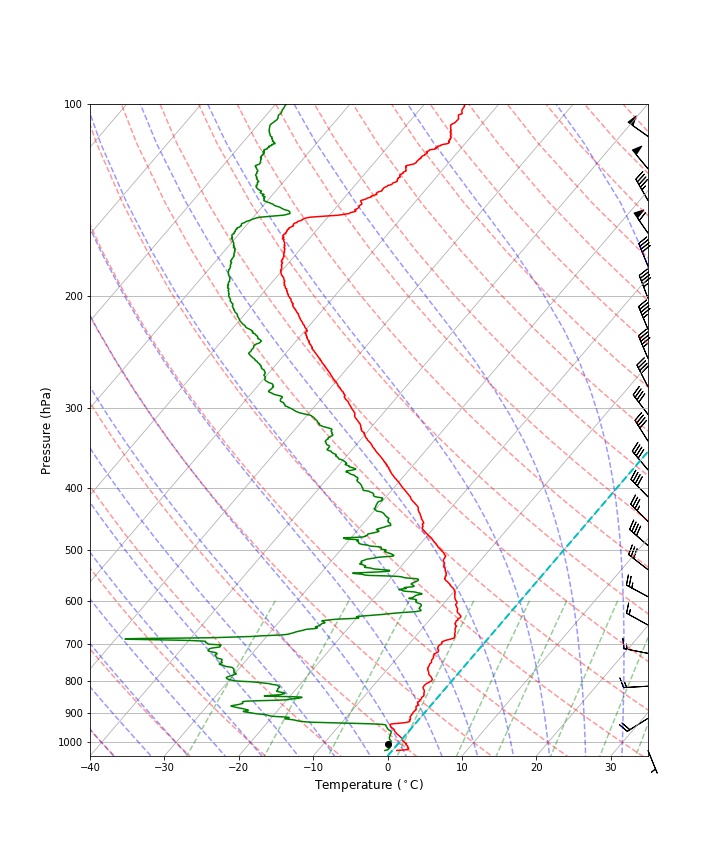
Below, you can see the SkewT diagram that is created from the data from our radio sounding. The effects of the subsidence of the strong high pressure system can be seen very clearly in our SkewT. We see a strong inversion around 940 hPa, above which the air becomes way drier (which we can see from the very low dewpoint. This is typically what you can expect under influence of a high pressure system. At the top of the boundary layer, we see that the air is very moist and (almost) saturated. This is probably the same height as where the stratocumulus clouds were present.

Other things we can see are a strong surface inversion (which you can expect this time of year at this time in the morning) and some instability between 570 and 550 hPa, where the air lapse rate seems to be steeper than that of the dry adiabate. This might be the height at which the altocumulus was present. There are some minor inversions in the lowest part of our free troposphere and then there is one very clear inversion around 160 hPa. This inversion indicates the tropopause and above this, we get into the stratosphere.
Lastly, from the wind profile, we can very clearly see that warm air advection is taking place in basically the whole troposphere. This can be seen from the veering of the wind throughout the atmospheric profile (mind that part of the veering of the wind in the boundary layer is caused by the decrease in surface friction with height). From the thermal wind law, we know that cold air is located left of the thermal wind, whereas warm air is located right of the thermal wind. This tells us that when the wind is veering with height, warm air advection is taking place. The warm air advection in the profile is nicely in line with the weather chart shown earlier in this blog.
Conclusions
The radio sounding and the report was not the only part of this course, but in my opinion it was definitely the most fun part. I also love to analyse SkewT diagrams, as they contain so much information! More of my experiences at the University of Helsinki will be posted in the future.


