Welcome to already the 5th edition of our “Climate Figure of the Day” series! Every day, I’ll be sharing a climate or climate change related figure. This month, I will focus on figures related to the past fall, December, the winter season and Christmas! The figures will be posted on Twitter/X.com too, under the hashtag #ClimateFigureOfTheDay. While Twitter gives you a snapshot, here on my website, every now and then, I might delve a bit deeper into the details. Want to stay updated? Be sure to follow me on Twitter/X.com here.
Find January 2024’s ClimateFigureOfTheDay here.
31 December
The warmest year on record in The Netherlands, also turned out to be the wettest on record (measured over 13 rain gauges nation wide – the Netherland’s main weather station in De Bilt was measured the 2nd wettest year on record). More about record-breaking 2023 in the Netherlands here.
29 December
Today’s Climate Figure of The Day shows how the Netherlands is getting warming, while the sunshine and precipitation show increasing trends too. This is Climate Change in the Netherlands.
This year was in many ways fitting in this new climate. Record rainfall, record warm, and yet a period of drought; read all about it here.
28 December
Sweden’s Capital, Stockholm, is experiencing less and less cold Decembers as the month is warming.
24 December
Merry Christmas! In today’s #ClimateFigureOfTheDay, we have a look at how the probability of a white Christmas Eve has decreased over Europe. Regionally, the snow probability has decreased with 50%pt!
22 December
The sea level is rising not only in The Netherlands (see 17 December’s #ClimateFigureOfTheDay), but on a global scale. And also globally, the rate of sea level rise is increasing, meaning that the sea level rise is accelerating.
19 December
December temperatures in the Netherlands have been clearly increasing since the start of the measurements. However, cold Decembers might still occur sporadically. Last time this was the case, was in the very snowy December of 2010.
18 December
One week until Christmas Day! Our Climate Figure Of The Day shows the change in white christmas probability, comparing the current (1991-2020) climatological norm with that of 40 years earlier (1951-1980). In most regions, the probability of a white Christmas has strongly decreased. This is especially the case in many states in the north of the US and south of Canada.
In the middle and south, there are also states that show an increased probability of a white christmas over this period. Wonder why? Read an extensive analysis on the probability of a white christmas in North America here.
17 December
The sea level is rising, also along the coast of my homecountry. Deltares found that the sea level rise has accelerated.
15 December
This climate figure of the day, shows how many of the 4 seasons have warmed at a level that is statistically significant. In almost all regions of the world, at least 1 season has significantly warmed. In most regions, all seasons have statistically significantly warmed. There are also seasons that saw cooling in certain season(s), but those regions are much, much less widespread. This is what you’d expect in a warming climate.
12 December
Malaga almost measured 30°C, in December! About 10 days before the shortest day of the year. A truly record-shattering event, surpassing the old December record by almost 5°C. Breaking old records in a time series that long by such margins, is virtually impossible in a stable climate.
11 December
The Northern Hemisphere autumn was extremely warm globally. Truly a record shattering event. This is not what natural climate variability looks like.
10 December
White Christmases in Europe are on the decline. More here.
9 December,
Today’s #ClimateFigureOfTheDay: Autumn in Longyearbyen, Svalbard was cold relative to the current climate, and colder than many of the recent years.
However, in historical terms, the fall was not cold at all. Since 1975, the autumn in #Svalbard has been warming with a striking 1°C/decade.
8 December
A lookback on last fall. Despite the coldest October since 2009 and coldest November since 2016, the autumn as a whole was rather warm in Finland, with an average temperature of 7.4°C. This is in large part due to the record warm month of September, which was almost 1°C warmer than the previous warmest September.
7 December
The world map of November shows: regionally it can still be very cold in a warming climate. November was rich in snow and ice in almost all of Scandinavia. However, most of the world colors dark red, meaning temperatures (well) above the norm.
6 December
Global surface temperatures are higher than ever measured before this time of year, and have been for many months in a row now.
5 December
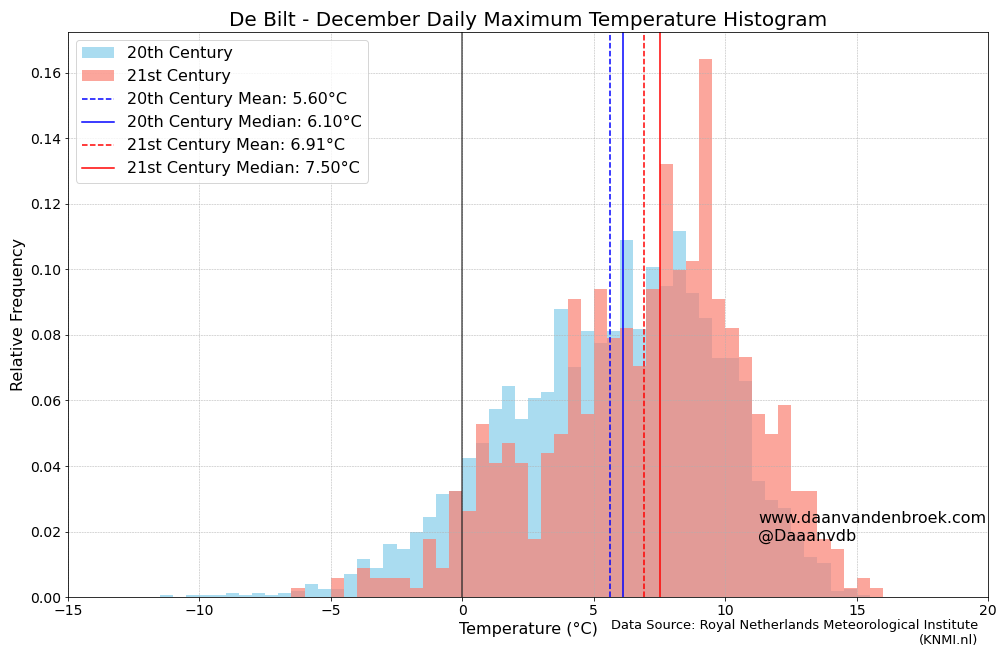
Today’s ClimateFigureOfTheDay: De Bilt’s daily maximum temperatures in December reveal a warming trend. The blue and red histograms show a rightward shift from the 20th to the 21st century, indicating colder days are becoming more rare, and mild days are becoming more frequent.
20th-century average maximum temperatures at 5.6°C have warmed with 1.3°C to a 21st-century average of 6.91°C. The winter bite is softening, with fewer days dipping into lower temperatures.

4 December
Globally, the month of November 2023 was again the warmest ever recorded and a truly record-shattering event: never before was the previous November record broken by such a large margin.
2 December
The amount of frost days in December in Helsinki is rapidly declining. This year, we saw relatively many, compared to recent years.
Climate Figure of The Day, 1 December
November was the coldest in Helsinki since 2016. Colder than many recent years, but nothing extreme in a historical perspective. Overall, November shows a rapidly warming trend.
For earlier Climate Figures of The Day, I refer you to these links below:
Climate Figure of The Day November: click here.
Climate Figure of The Day October: click here.

